
The average Ashford home reached £347,562 in July, up £4,674 in a year. It is still £550 short of its January 2023 value, and 7th of 13 in Kent for growth.
The average home in Ashford borough was worth £347,562 in July 2026, £4,674 more than a year earlier. That is a rise of 1.4%, and it is the highest monthly average the borough has recorded in at least fifteen months.
It is also, on the same official measure, still slightly less than the same average home was worth three and a half years ago. In January 2023 the borough average was £348,112. Ashford has spent the entire period since then getting back to roughly where it started, and in July it was £550 short.
The figures come from the UK House Price Index, published by HM Land Registry from completed sales rather than asking prices. One thing to hold on to before any of the numbers below mean much: the UKHPI average is a mean, not a median. A handful of expensive sales pull it upwards, so it sits above the price of a typical Ashford sale.
Why January 2023 is the number to watch
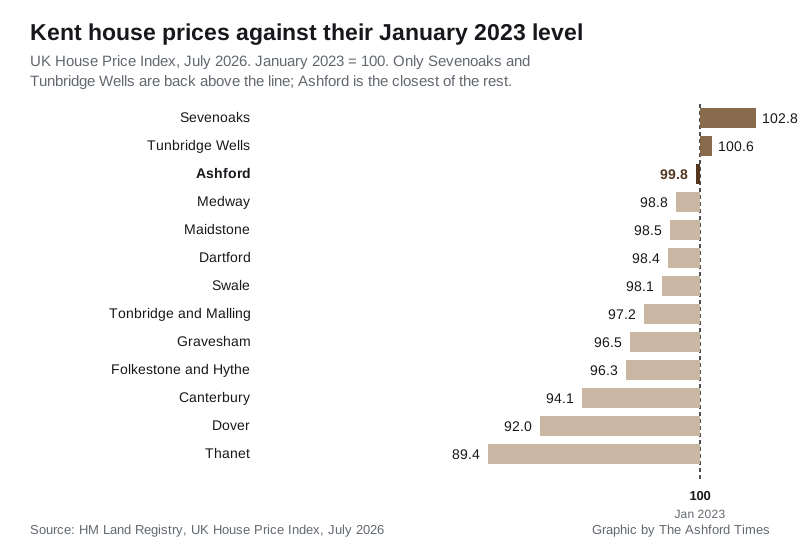
The index is set so that January 2023 equals 100 for every area. Ashford’s reading for July 2026 is 99.8. Anything under 100 means the average home in that area is worth less than it was at the start of 2023.
Only two places in Kent are above the line. Sevenoaks stands at 102.8 and Tunbridge Wells at 100.6. The other eleven, Ashford included, are still below where they were. What is notable is that Ashford is the closest of those eleven to recovering. On this measure the borough has held its value better than every other part of Kent apart from its two most expensive districts.
Ashford against the rest of Kent
Ranked by annual growth, Ashford comes 7th of Kent’s 13 local authority areas in July. The borough’s £347,562 average is almost identical to Dartford’s and a little under Maidstone’s, and it sits just above the Kent-wide figure of £346,904.
| Area | Average price | Change in a year | Index (Jan 2023 = 100) |
|---|---|---|---|
| Gravesham | £344,923 | +£11,179 (+3.3%) | 96.5 |
| Swale | £298,985 | +£9,321 (+3.2%) | 98.1 |
| Canterbury | £337,454 | +£9,640 (+2.9%) | 94.1 |
| Dover | £277,750 | +£7,363 (+2.7%) | 92.0 |
| Thanet | £269,708 | +£4,701 (+1.8%) | 89.4 |
| Tonbridge and Malling | £407,880 | +£5,607 (+1.4%) | 97.2 |
| Ashford | £347,562 | +£4,674 (+1.4%) | 99.8 |
| Medway | £298,547 | +£3,177 (+1.1%) | 98.8 |
| Sevenoaks | £538,714 | +£5,566 (+1.0%) | 102.8 |
| Folkestone and Hythe | £303,296 | +£2,671 (+0.9%) | 96.3 |
| Tunbridge Wells | £456,227 | +£2,661 (+0.6%) | 100.6 |
| Maidstone | £352,722 | -£256 (-0.1%) | 98.5 |
| Dartford | £347,773 | -£7,043 (-2.0%) | 98.4 |
Two things are worth pulling out of that table. Kent’s cheaper districts are rising fastest, from a lower base: Gravesham in the north and Swale, Canterbury and Dover in the east fill the top four places. Canterbury and Dover are also two of the three areas furthest below their 2023 level, so they have the most ground to make up. And Dartford is the only area where prices fell by a meaningful amount, down £7,043 in twelve months.
Across the South East as a whole the average reached £380,878 in July, up just 0.2% in a year. Ashford is therefore £33,316 cheaper than the regional average and rising faster than it.
Which Ashford homes moved, and which did not
The borough average hides four very different markets. Three types rose and one fell.
| Property type | July 2026 average | Change in a year |
|---|---|---|
| Detached | £561,027 | +0.9% |
| Semi-detached | £347,876 | +2.3% |
| Terraced | £285,738 | +2.1% |
| Flat or maisonette | £164,305 | -1.3% |
Semi-detached homes did best, up 2.3%, with terraces close behind on 2.1%. Detached homes, already the most expensive by a wide margin, managed only 0.9%.
Flats are the exception and have been for a while. At £164,305 the average Ashford flat is worth 1.3% less than a year ago, and it is the only category in the borough going backwards. The annual change for flats has been negative in every month since March.
The longer view is starker. The flat index stands at 94.8, so the average Ashford flat is 5.2% below its January 2023 value while the borough as a whole is 0.2% below. Flats have not collapsed, though: they bottomed at £162,431 in April and have edged up in each of the three months since. It matters more here than in much of Kent, because flats are the entry point to the Ashford market for many first-time buyers and the stock is concentrated in the town centre.
Speaking of which, the average first-time buyer purchase in the borough was £287,709 in July, up 1.7% on the year.
A note on the June figure we published
Last month we reported the June 2026 borough average as £344,332. HM Land Registry has since revised it to £345,233, £901 higher.
That is normal rather than an error. UKHPI figures for recent months are provisional and get restated as more completed sales are registered, and the most recent two or three months move most. It is worth knowing if you are tracking the index yourself: the first number published for any month is rarely the final one.
On the revised series, Ashford’s monthly run looks like this: £347,306 in February, £343,872 in March, £342,484 in April, £344,804 in May, £345,233 in June and £347,562 in July. April was the low point of the year so far.
The annual growth rate has been just as jumpy. It reached 3.6% in both January and February, fell away to 0.5% by June, and has now recovered to 1.4%. July is an improvement on the spring, but it is not a return to the start of the year.
What it means for you
If you are selling. The direction has turned, but gently: £4,674 on an average home over a full year. If you bought in 2023 or later, the index says you should not assume much equity has built up underneath you from price growth alone.
If you are buying. Ashford remains one of the cheaper parts of the South East, £33,316 below the regional average, with a fast line into London from Ashford International. The type you choose now makes a material difference to the next few years: semis and terraces are moving, flats are not.
If you own a flat. A 1.3% fall is small in itself, but houses have risen while flats have not, and flats remain 5.2% below their January 2023 level against 0.2% for the borough. If you are trying to move up from a flat to a house, that gap has been widening rather than closing.
A caution on all of it. These are borough-wide means covering Ashford town, Tenterden and every village from Charing to Hamstreet. Tenterden sells well above the borough average and parts of south Ashford well below it. For the figure that applies to your own street, the Land Registry price paid data lists actual sales by postcode, and our Ashford house prices page sets out the town and village breakdown. Your council tax band is a separate thing entirely and does not move with prices, because bands still rest on 1991 values.
The next UKHPI release, covering August 2026, is due in mid-October.
Sources
- HM Land Registry, UK House Price Index, Ashford, July 2026
- HM Land Registry, UK House Price Index, Kent and the South East, July 2026
- HM Land Registry, UKHPI open data for Ashford, January 2023 and February to July 2026
- HM Land Registry, Price Paid Data
Have your say