
The average Ashford home fell to £340,991 in August, £2,645 down on a year earlier and the borough's first annual fall since March 2025. Flats fell 3.1%.
The average home in Ashford borough was worth £340,991 in August 2026. That is £2,645 less than a year earlier, a fall of 0.8%.
It is the first time the borough’s average has been lower than a year before since March 2025. For the seventeen months in between, Ashford prices were flat or rising.
The figures come from the UK House Price Index, which HM Land Registry builds from completed sales, not asking prices. The UKHPI average is a mean, not a median. A few expensive sales pull it up, so it sits above the price of a typical Ashford sale.
A sharp month, and an early figure
Most of the fall happened in a single month. The borough average dropped £7,426 between July and August, or 2.1%. The index has not fallen that far in one month since April 2023, when it also fell 2.1%.
Treat that August number with care. The most recent months in the index are provisional, and they change as more completed sales are registered. Last month we reported July at £347,562. Land Registry has since revised July up to £348,417, £855 higher. August could move just as much when it is restated next month.
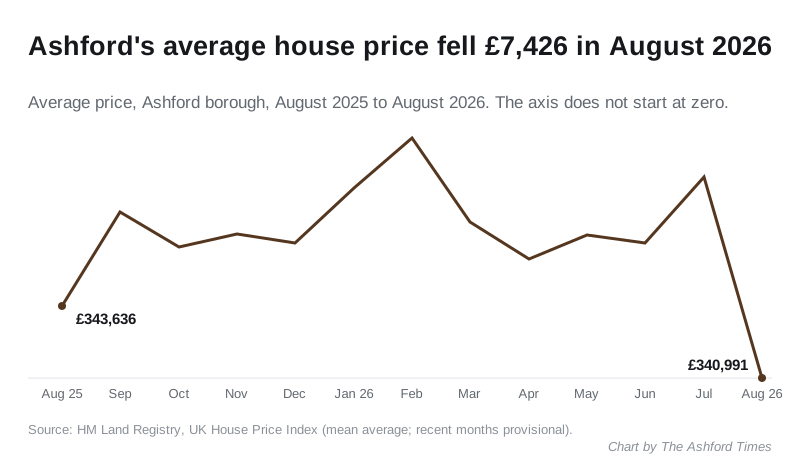
On the revised series, the borough average went:
- £343,636 in August 2025
- £349,850 in February 2026, the high point of the year
- £345,390 in April
- £348,417 in July
- £340,991 in August
Back below the 2023 line
The index is set so that January 2023 equals 100 for every area. On the revised figures, Ashford’s July reading was 100.1, which put the average home just above its January 2023 value of £348,112 for the first time.
August took it back to 98.0. The average Ashford home is now £7,121 below where it was at the start of 2023.
Ashford against the rest of Kent
Ashford is not alone. Eight of Kent’s 13 local authority areas recorded an annual fall in August, and the Kent average slipped 0.5% to £345,200. Across the South East the average was £379,953, down 0.8%, the same rate as Ashford. England as a whole was still up 0.4%.
| Area | Average price, August 2026 | Change in a year | Index (Jan 2023 = 100) |
|---|---|---|---|
| Swale | £296,578 | +0.6% | 97.3 |
| Medway | £297,757 | +0.5% | 98.5 |
| Dover | £282,945 | +0.4% | 93.7 |
| Sevenoaks | £535,810 | +0.4% | 102.2 |
| Gravesham | £342,498 | +0.3% | 95.8 |
| Tonbridge and Malling | £405,507 | -0.1% | 96.7 |
| Tunbridge Wells | £452,845 | -0.1% | 99.9 |
| Canterbury | £336,427 | -0.3% | 93.8 |
| Folkestone and Hythe | £302,106 | -0.7% | 95.9 |
| Ashford | £340,991 | -0.8% | 98.0 |
| Thanet | £268,549 | -0.8% | 89.0 |
| Maidstone | £352,878 | -1.1% | 98.5 |
| Dartford | £342,167 | -4.9% | 96.8 |
Ashford is joint 10th of 13 for annual growth, level with Thanet. In July it was 7th. Dartford remains the outlier, down 4.9% in a year.
On the longer measure Ashford still holds up better than most of the county. Its index of 98.0 is the fifth highest in Kent, behind Sevenoaks, Tunbridge Wells, Medway and Maidstone.
The borough is now £38,962 cheaper than the South East average.
Which Ashford homes moved
| Property type | August 2026 average | Change in a year |
|---|---|---|
| Detached | £549,212 | -1.2% |
| Semi-detached | £341,227 | 0.0% |
| Terraced | £280,890 | 0.0% |
| Flat or maisonette | £161,628 | -3.1% |
Semi-detached and terraced homes were unchanged on the year, to one decimal place. The fall came from both ends of the market: detached homes, down 1.2%, and flats, down 3.1%.
Flats have now fallen on the year in every month since March. The flat index stands at 93.2, so the average Ashford flat is 6.8% below its January 2023 value.
First-time buyers paid an average of £282,491, down 0.4% on the year. Buyers using a mortgage paid £336,663 on average, down 0.6%. Cash buyers paid £355,660, down 1.2%.
What it means for you
If you are selling. One provisional month is not a trend, and the index has swung like this before: it fell 2.1% in April 2023 and was rising again by the autumn. But the gains of the spring have gone. On these figures, a home bought in early 2023 is worth slightly less now than it was then.
If you are buying. Prices are softer than they were in the summer, and Ashford remains one of the cheaper parts of the South East, with fast trains into London from Ashford International. Semis and terraces are holding steady; flats are still losing ground.
If you own a flat. Flats are the weakest part of the borough market and have been all year. The gap between flats and houses has widened again, which makes moving up from a flat to a house harder.
A caution on all of it. These are borough-wide averages covering Ashford town, Tenterden and every village from Charing to Hamstreet. For actual sale prices on your own street, the Land Registry price paid data lists sales by postcode, and our Ashford house prices page breaks the borough down by town and village. Your council tax band does not move with prices, because bands still rest on 1991 values.
The next release, covering September 2026, is due in mid-November. Last month’s figures are in our July house prices report.
Sources
- HM Land Registry, UK House Price Index, Ashford, August 2026
- HM Land Registry, UK House Price Index, Kent, its 13 local authority areas, the South East and England, August 2026
- HM Land Registry, UKHPI open data for Ashford, monthly from January 2023 to August 2026
- HM Land Registry, Price Paid Data
Have your say